Reimagining the app experience
TOOLS
Figma, Claude Code, Google Stitch, UserZoom
DURATION
10 weeks, 2026
MY ROLE
Lead Designer
OVERVIEW
Driving app engagement through interactive prototyping.
As the lead designer and researcher, I benchmarked core usability metrics, developed a coded prototype featuring new reward systems, and successfully pitched the validated UX to Account Executives to drive future revenue goals. This work focused on strengthening comprehension, reinforcing feedback loops, and introducing a more expressive interaction model that aligns with Boost’s brand.
PROBLEM
Fixing broken feedback loops in a static, utility‑only app.
User research revealed a consistent gap: people struggled to understand where they were in a flow, what action to take next, and whether their submissions were successful. These breakdowns in clarity and feedback led to high drop‑off rates and stalled sessions across essential tasks.
SOLUTION
Prototyping in Code for high-fidelity validation. Play with it here.
To accurately test the impact of animations and interactive rewards, static screens weren't enough. I designed the core features in Figma and utilized Figma MCP and Claude Code to rapidly build a functional, interactive prototype. This allowed me to test real micro-interactions through unmoderated usability testing in UserZoom.
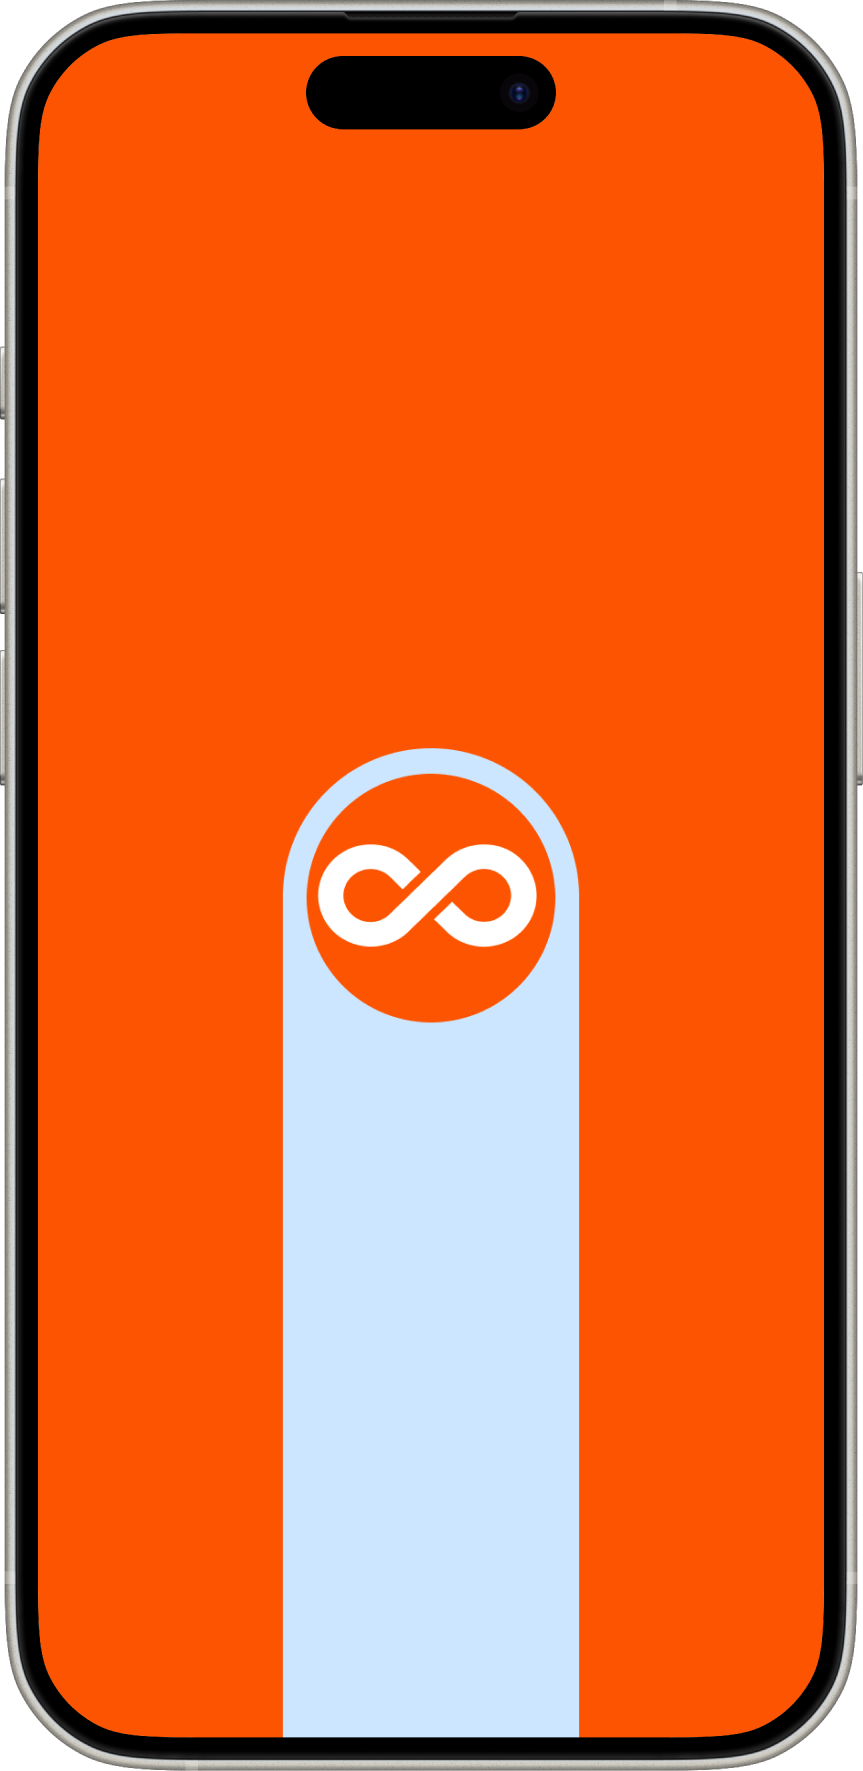
Boost as a feeling.
The bubble interaction model introduces a sense of momentum and delight without compromising clarity, increasing engagement across utility flows.
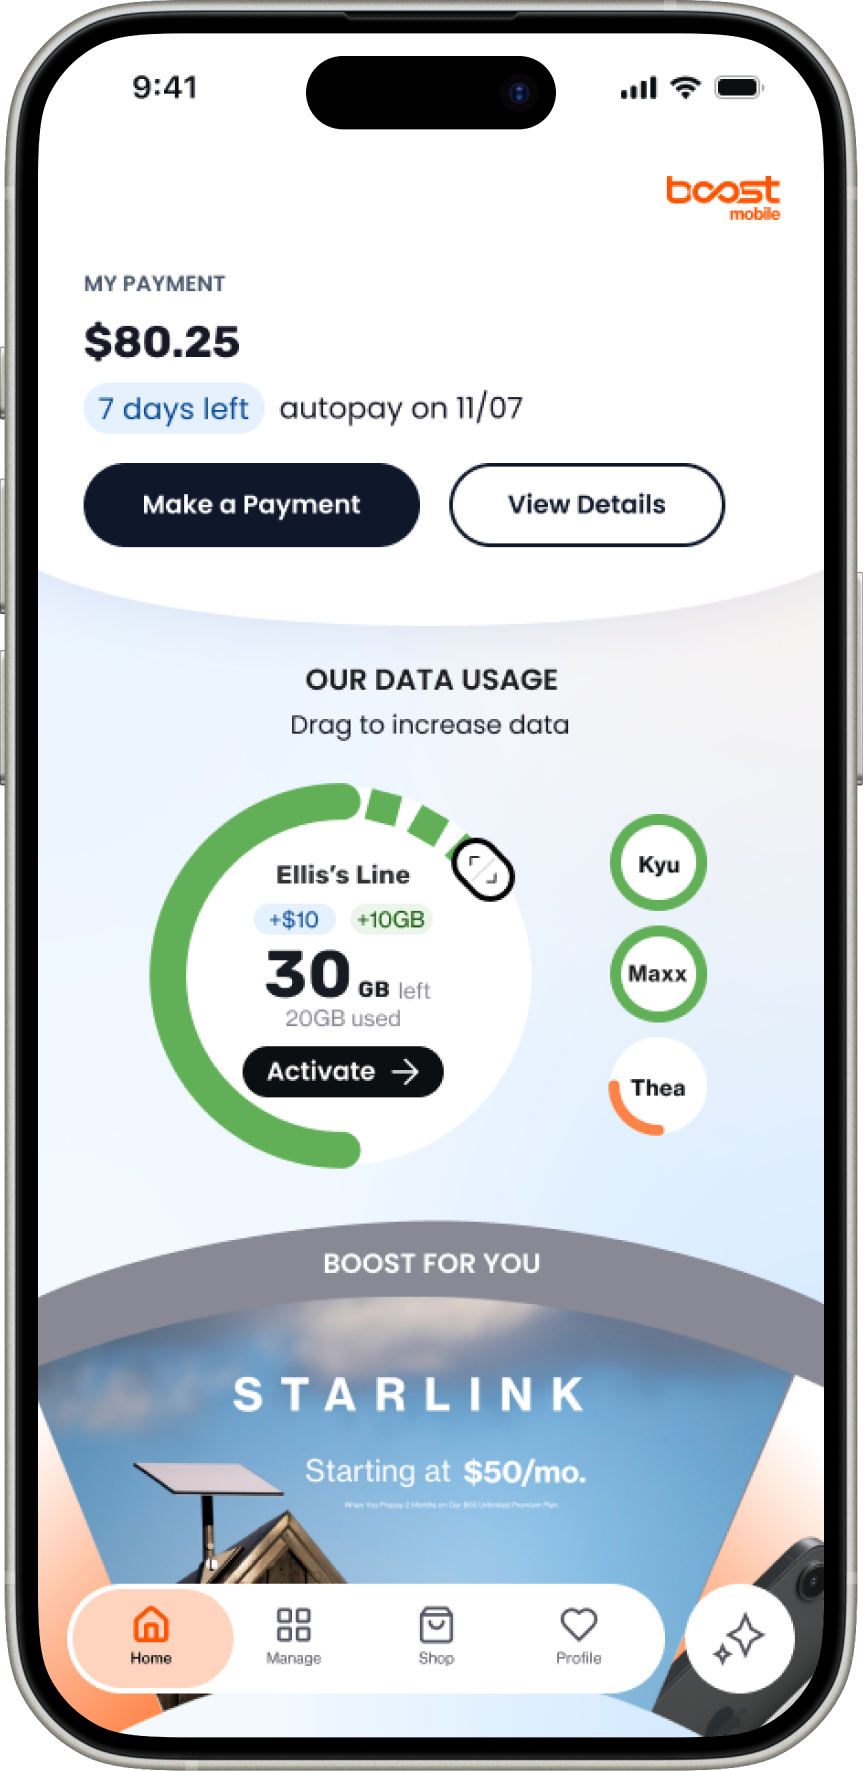
Simple data add interaction.
A reorganized layout and clearer hierarchy reduce cognitive load, helping users quickly find and understand their data usage.
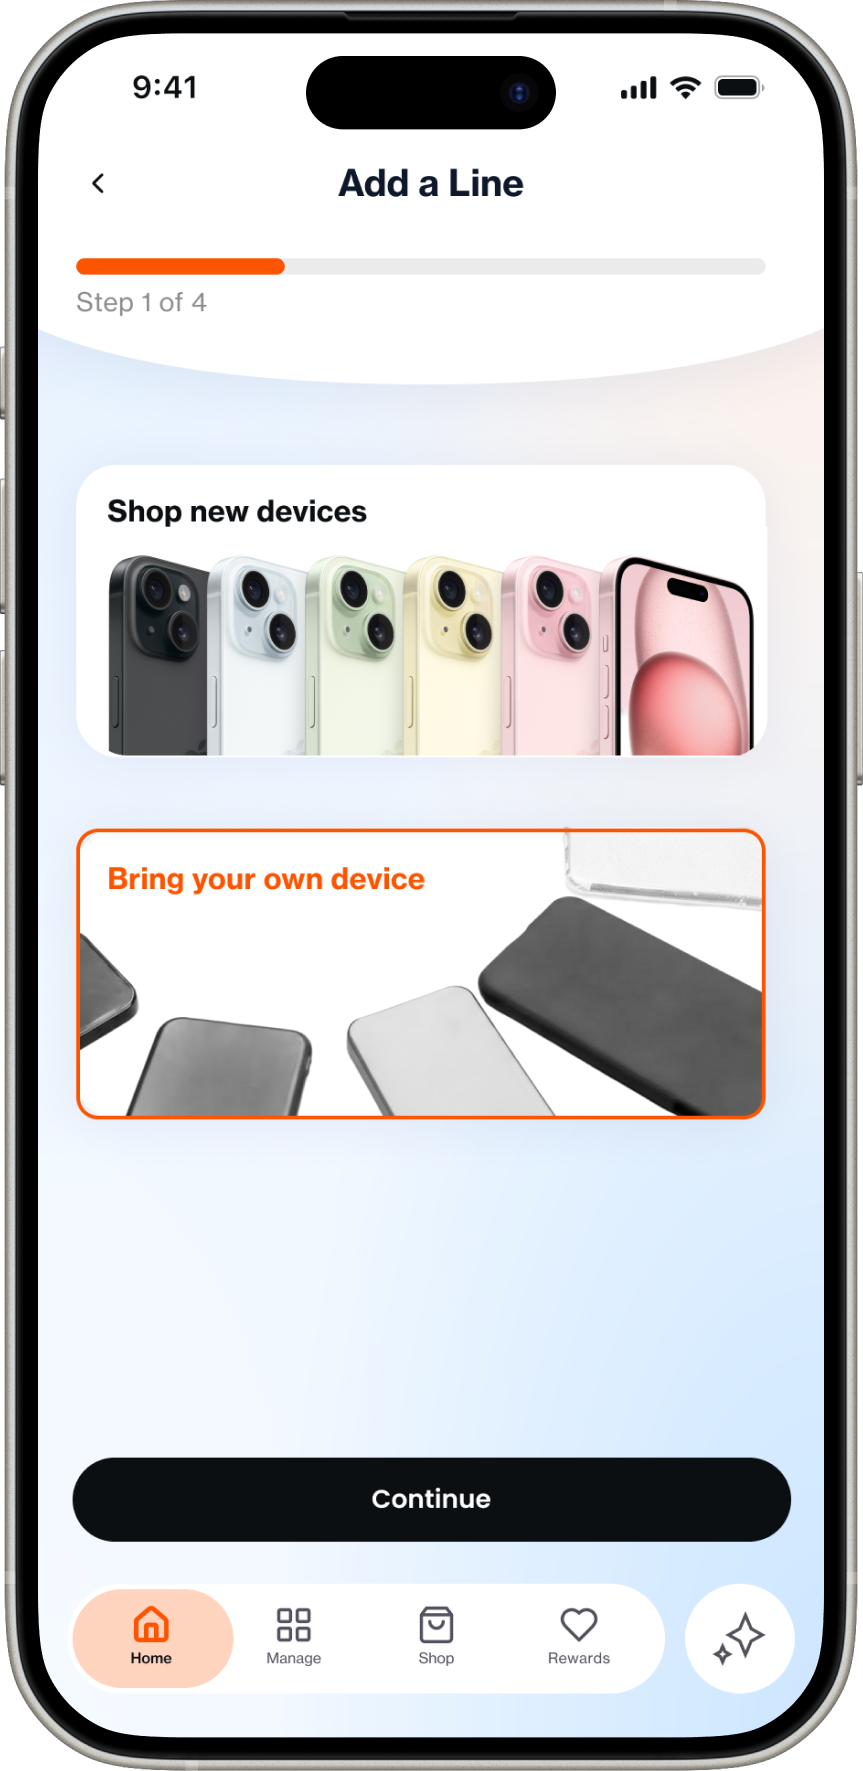
Guided task flow
Inline prompts and contextual cues clarify what to do next, improving comprehension for users who previously stalled mid-task.
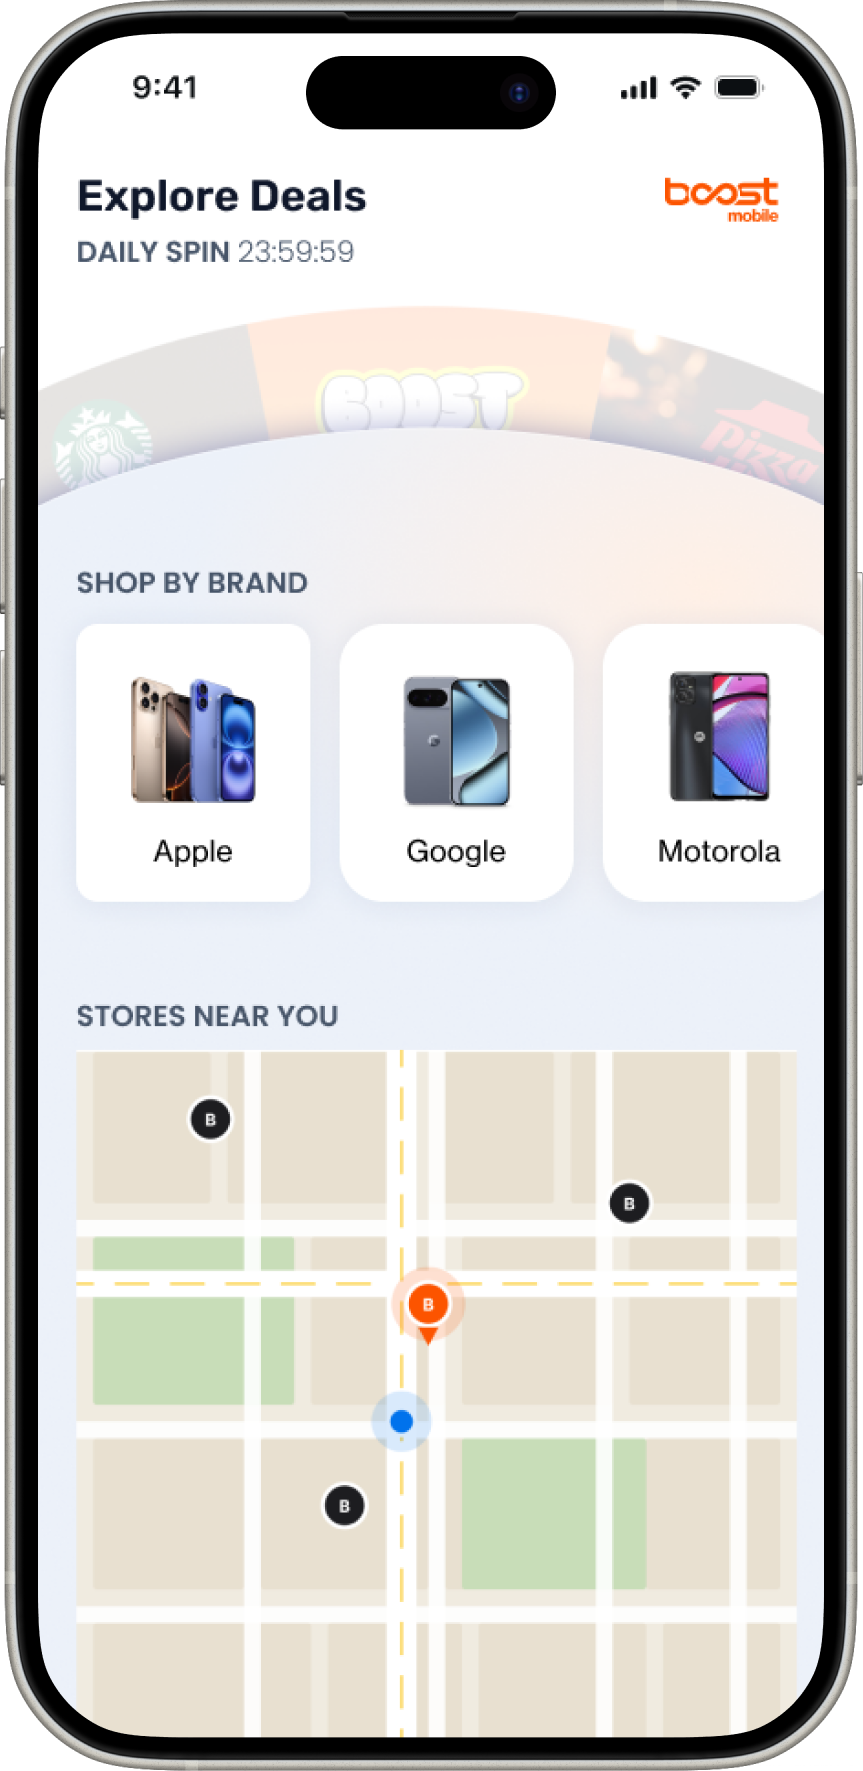
Engagement layer.
Monetization teams consistently surfaced our gap in offering relevant perks to customers. Further gamifying an interaction in app gave users a reason to return beyond monthly payment.
TESTING
Research surfaced what drove drop‑off, Boost Bubble closed them with measurable impact.
The unmoderated testing proved our hypothesis: the interactive, animated concept significantly improved completion rate and CES scores for key tasks. I leveraged these validated metrics and the coded prototype to pitch the new features directly to Account Executives.
 v1 benchmark
 v2 benchmark
 v2 benchmark 87%v2 benchmark 80%v1 benchmark 76%v1 benchmark 56%
 Add a bolt-onAdd a Line
 v1 benchmark 2.7v2 benchmark 1.9Check Data
PROCESS
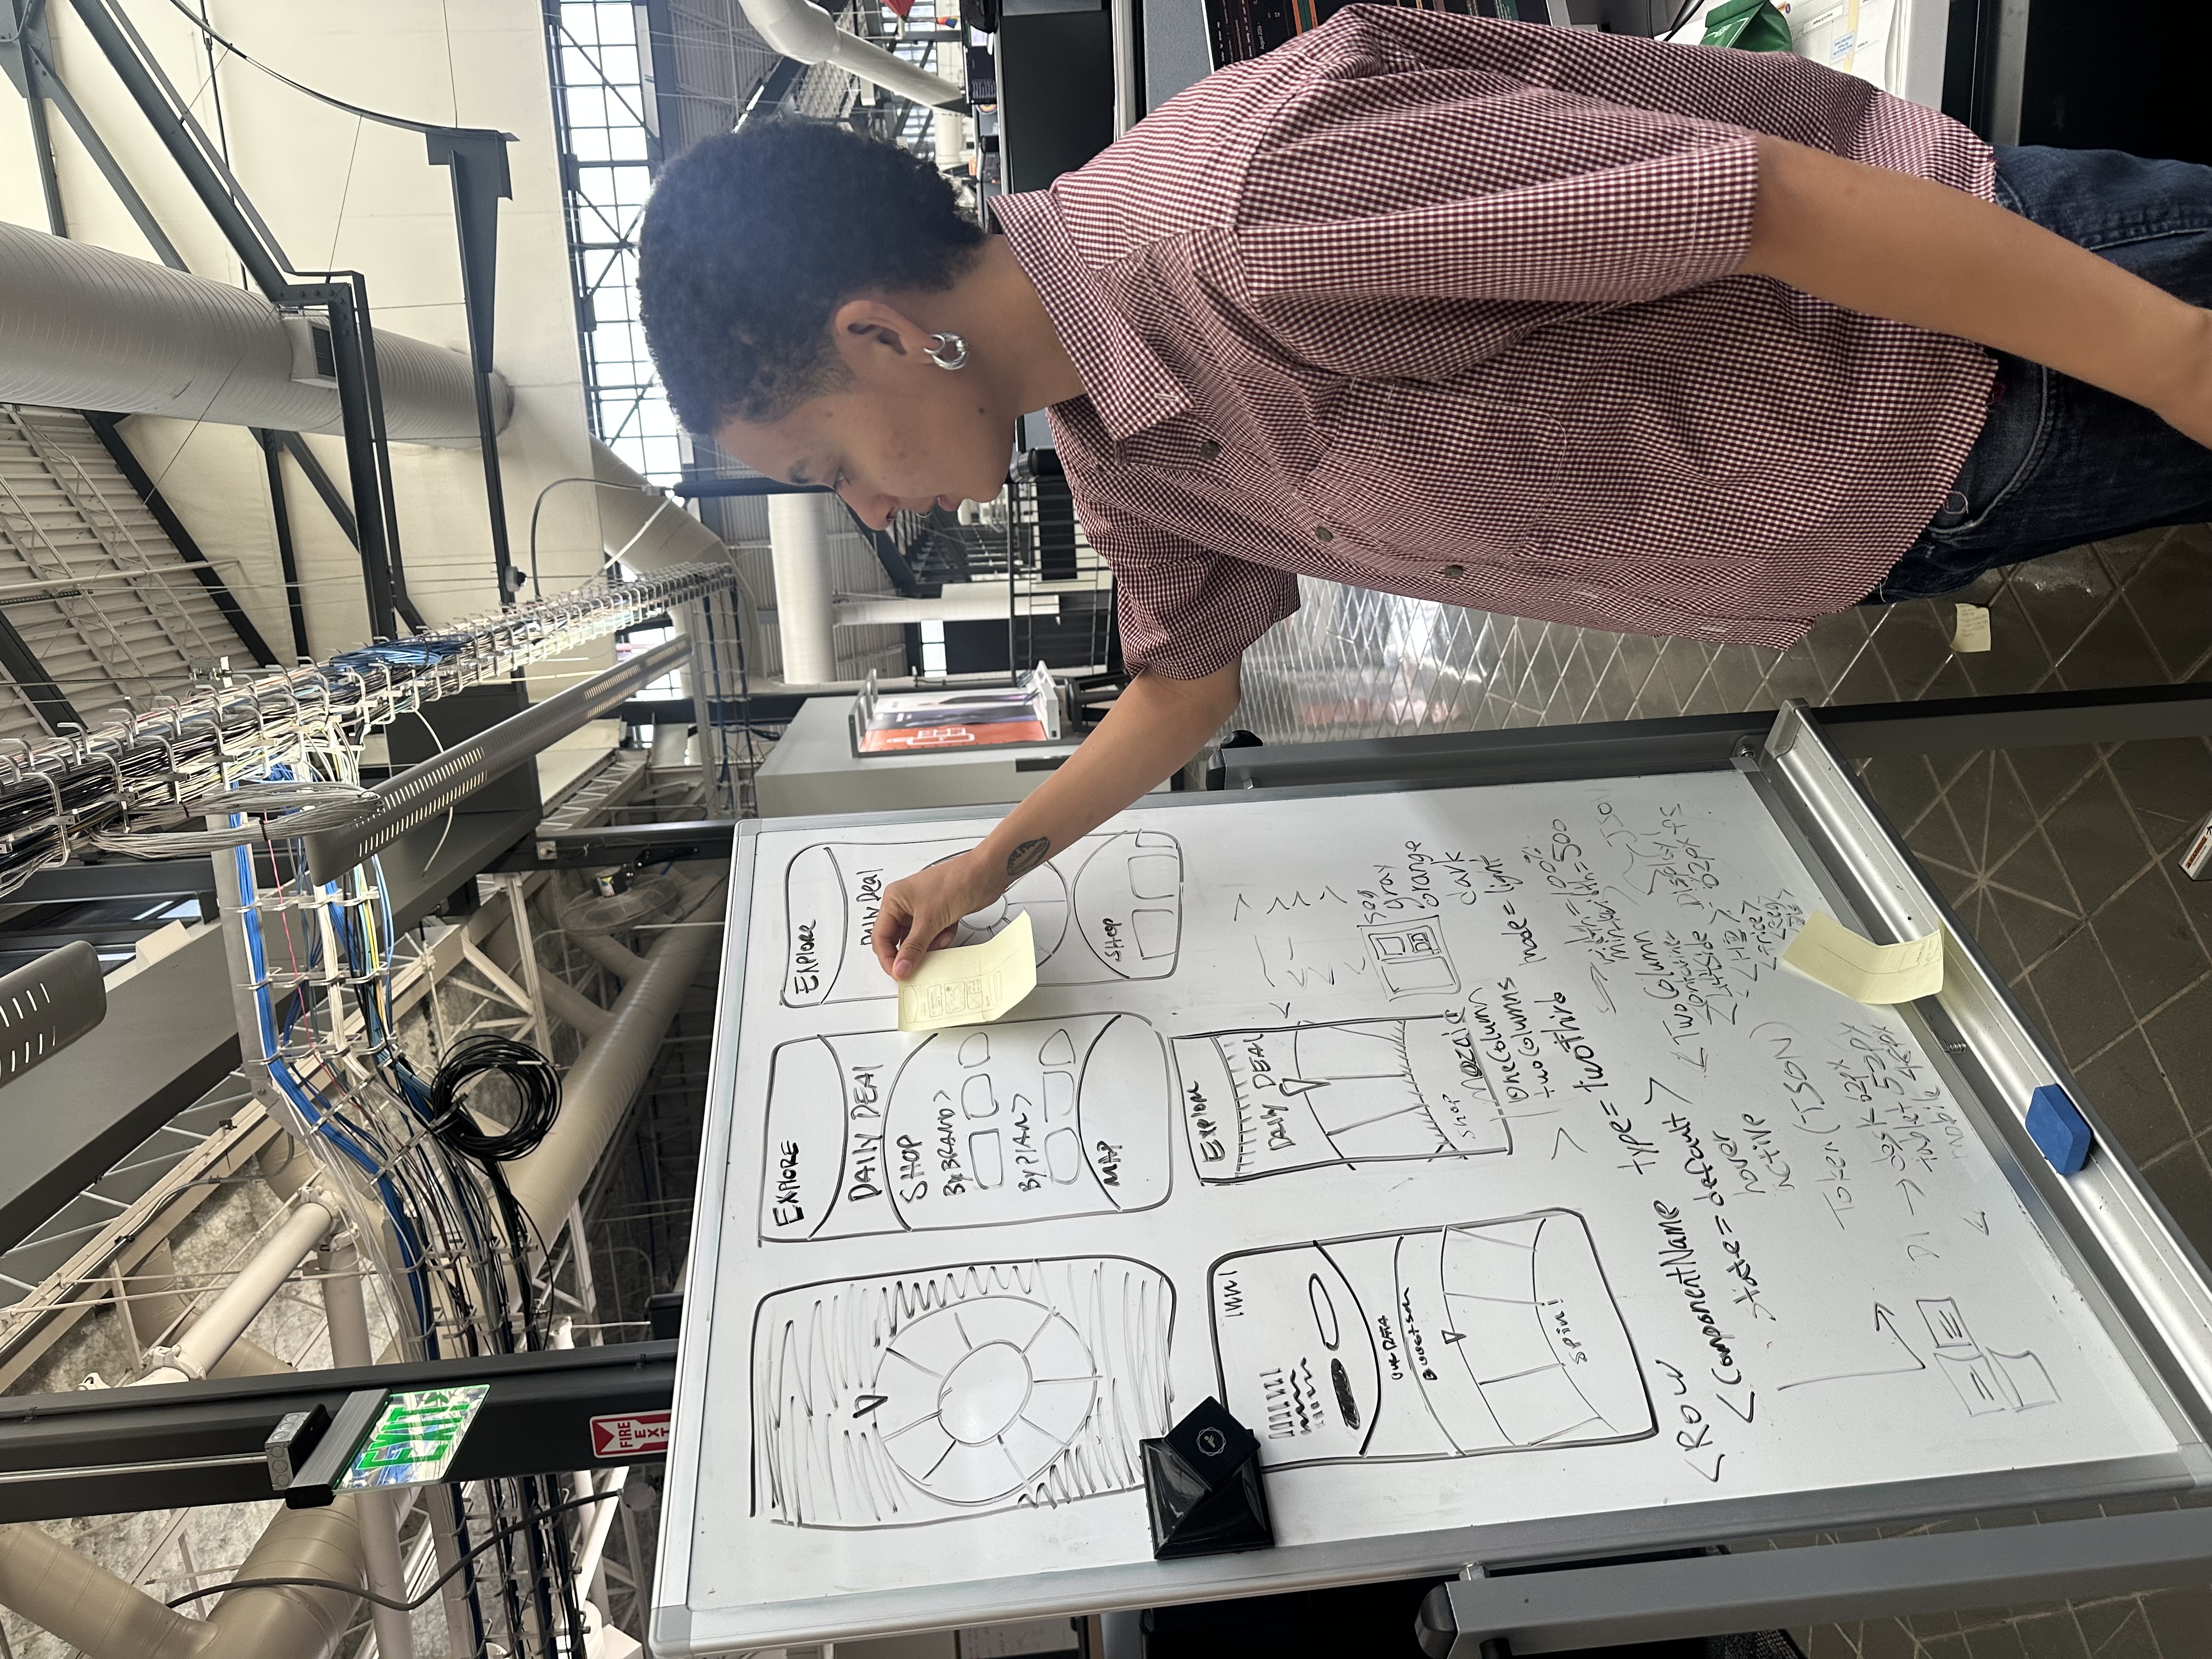
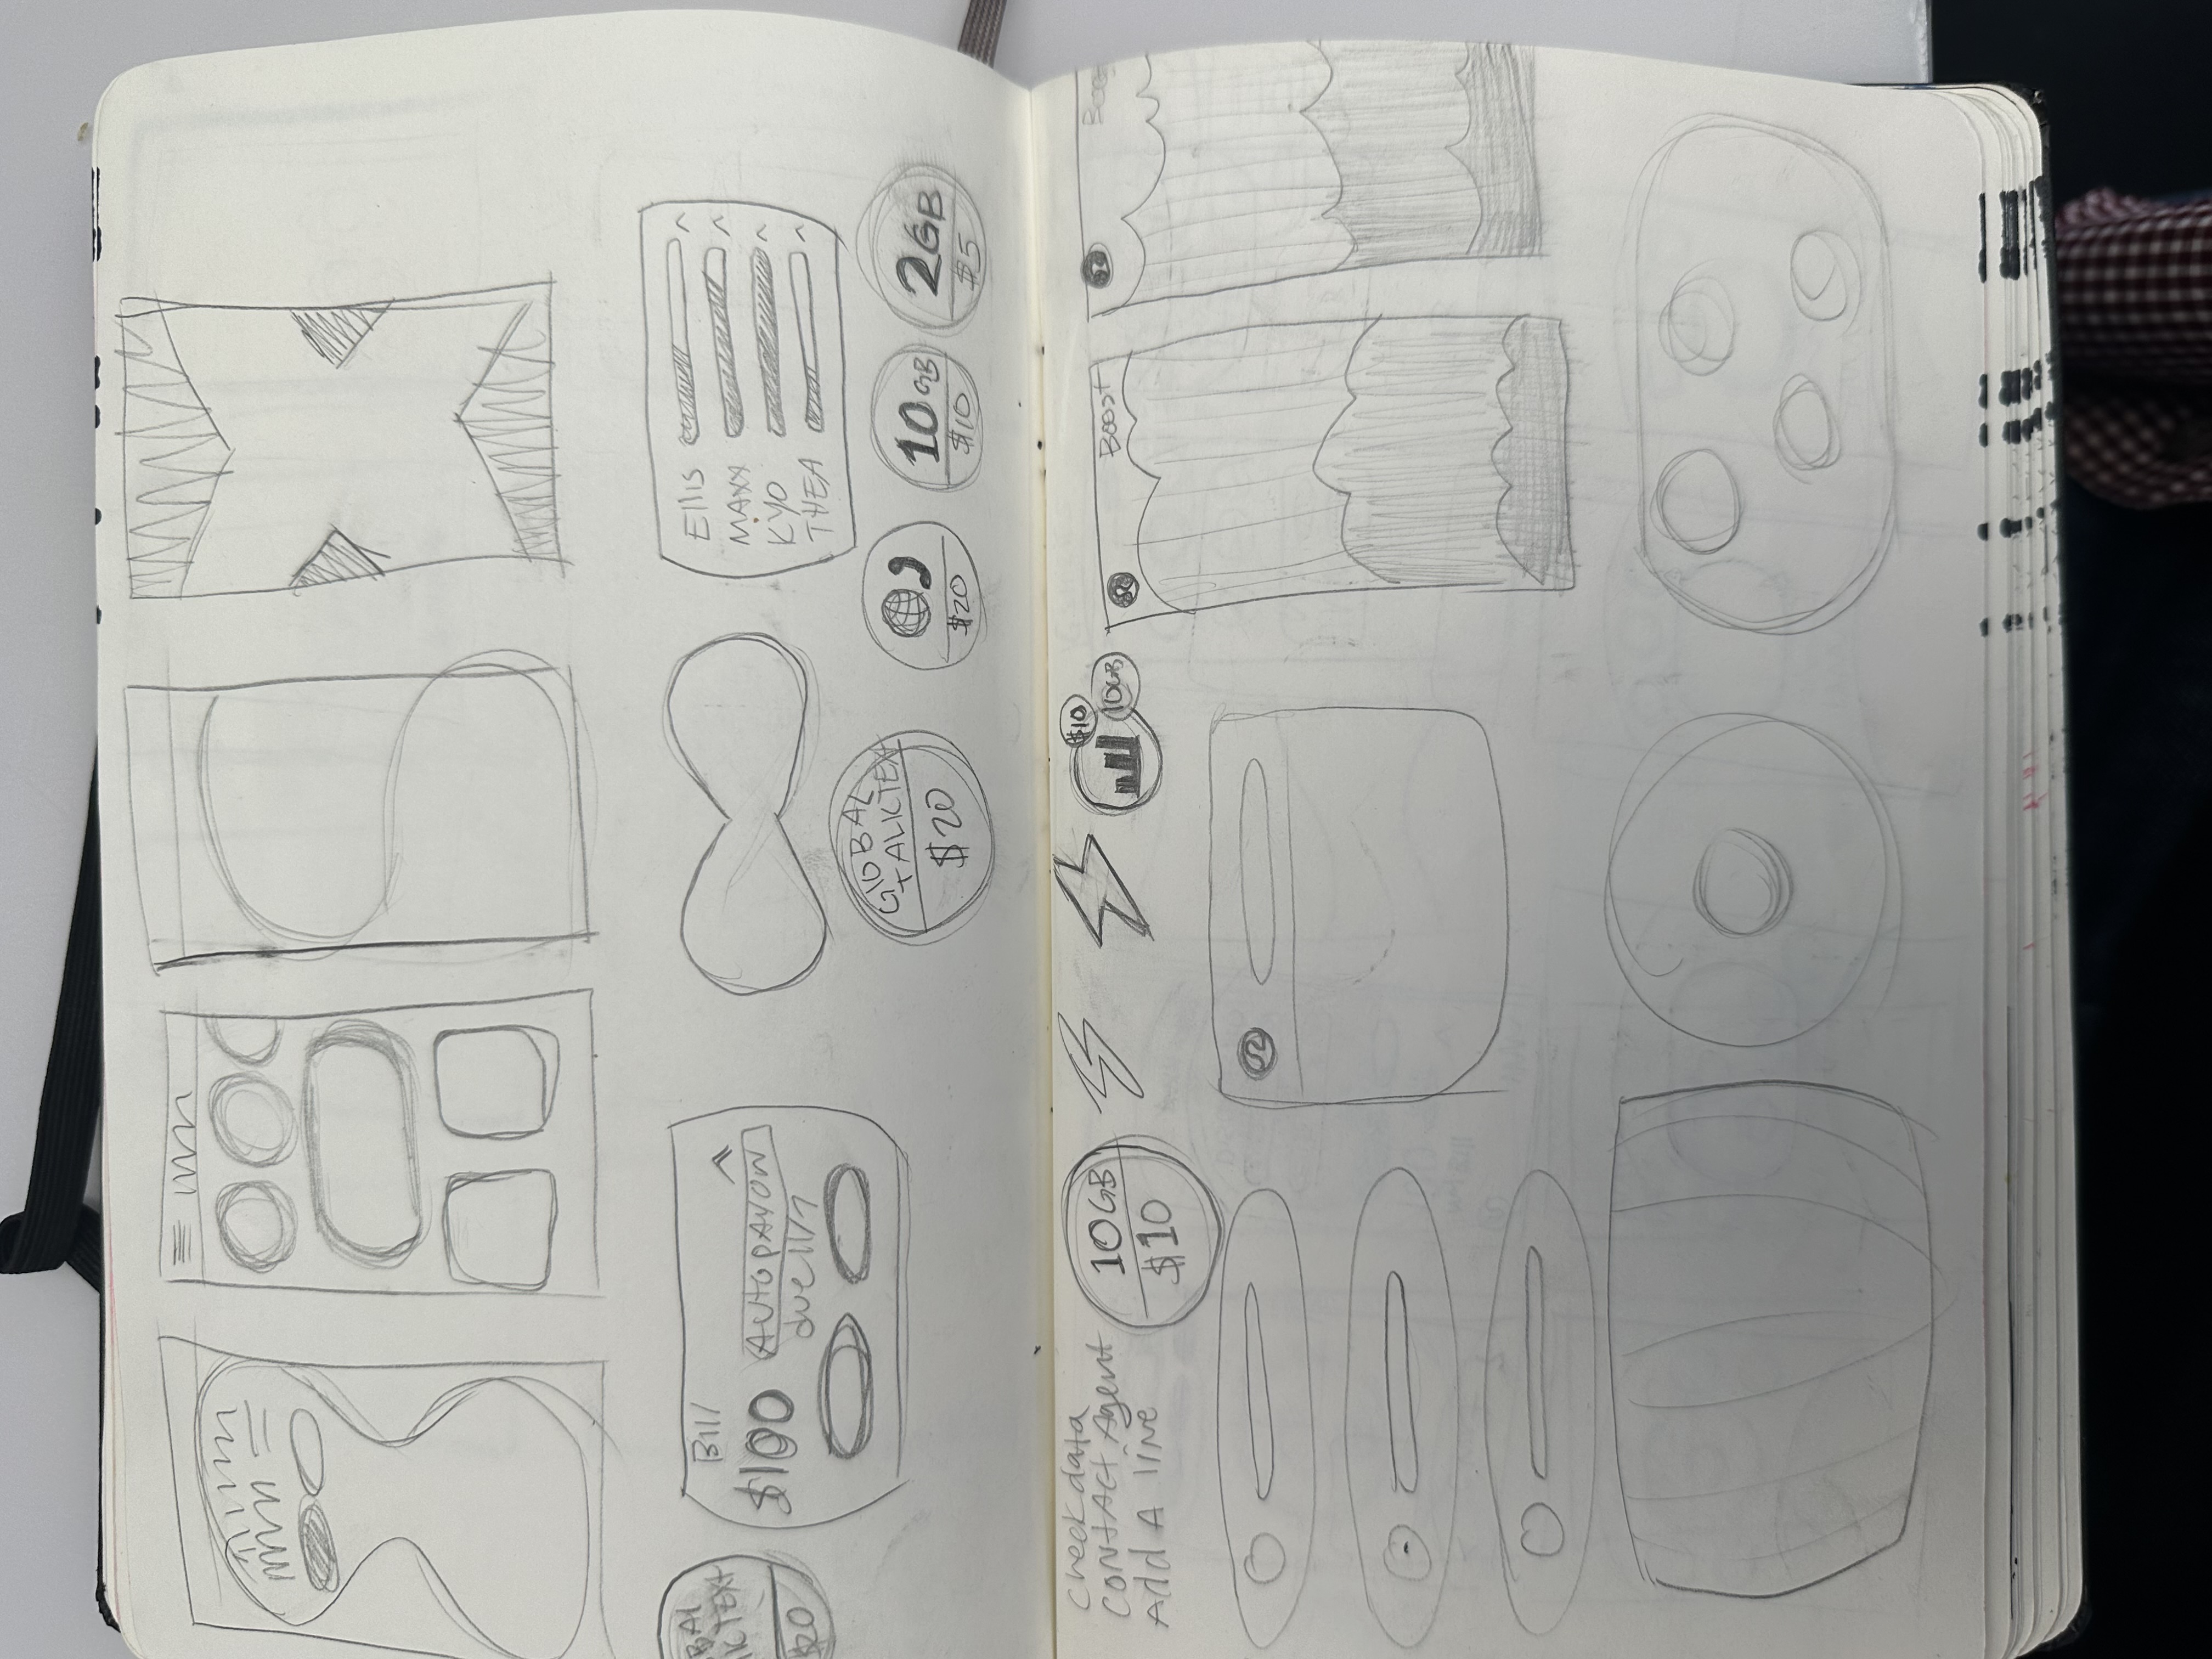
Brainstorming form factors and visual concepts.
I moved from paper rapid paper prototyping to visualizing through Figma Make, pitching 3 early concepts, and iterating on a final direction.
OUTCOME
From product strategy to prototype.
Measurable Usability Gains: Established baseline usability scores for key app journeys, ultimately driving a 18% increase in completion rate and a .8 point improvement in CES after testing the new design interventions. Advanced Technical Prototyping: Transitioned from static Fig, ma explorations to a fully functional coded prototype using Figma MCP and Claude Code. This enabled accurate, unmoderated UserZoom testing of complex micro-interactions, animations, and a native rewards system that static screens could not support. Cross-Functional Business Alignment: Synthesized the validated usability data and interactive prototype into a strategic presentation for 4 Account Executives, successfully demonstrating how targeted UX investments drive user engagement and support future business goals.